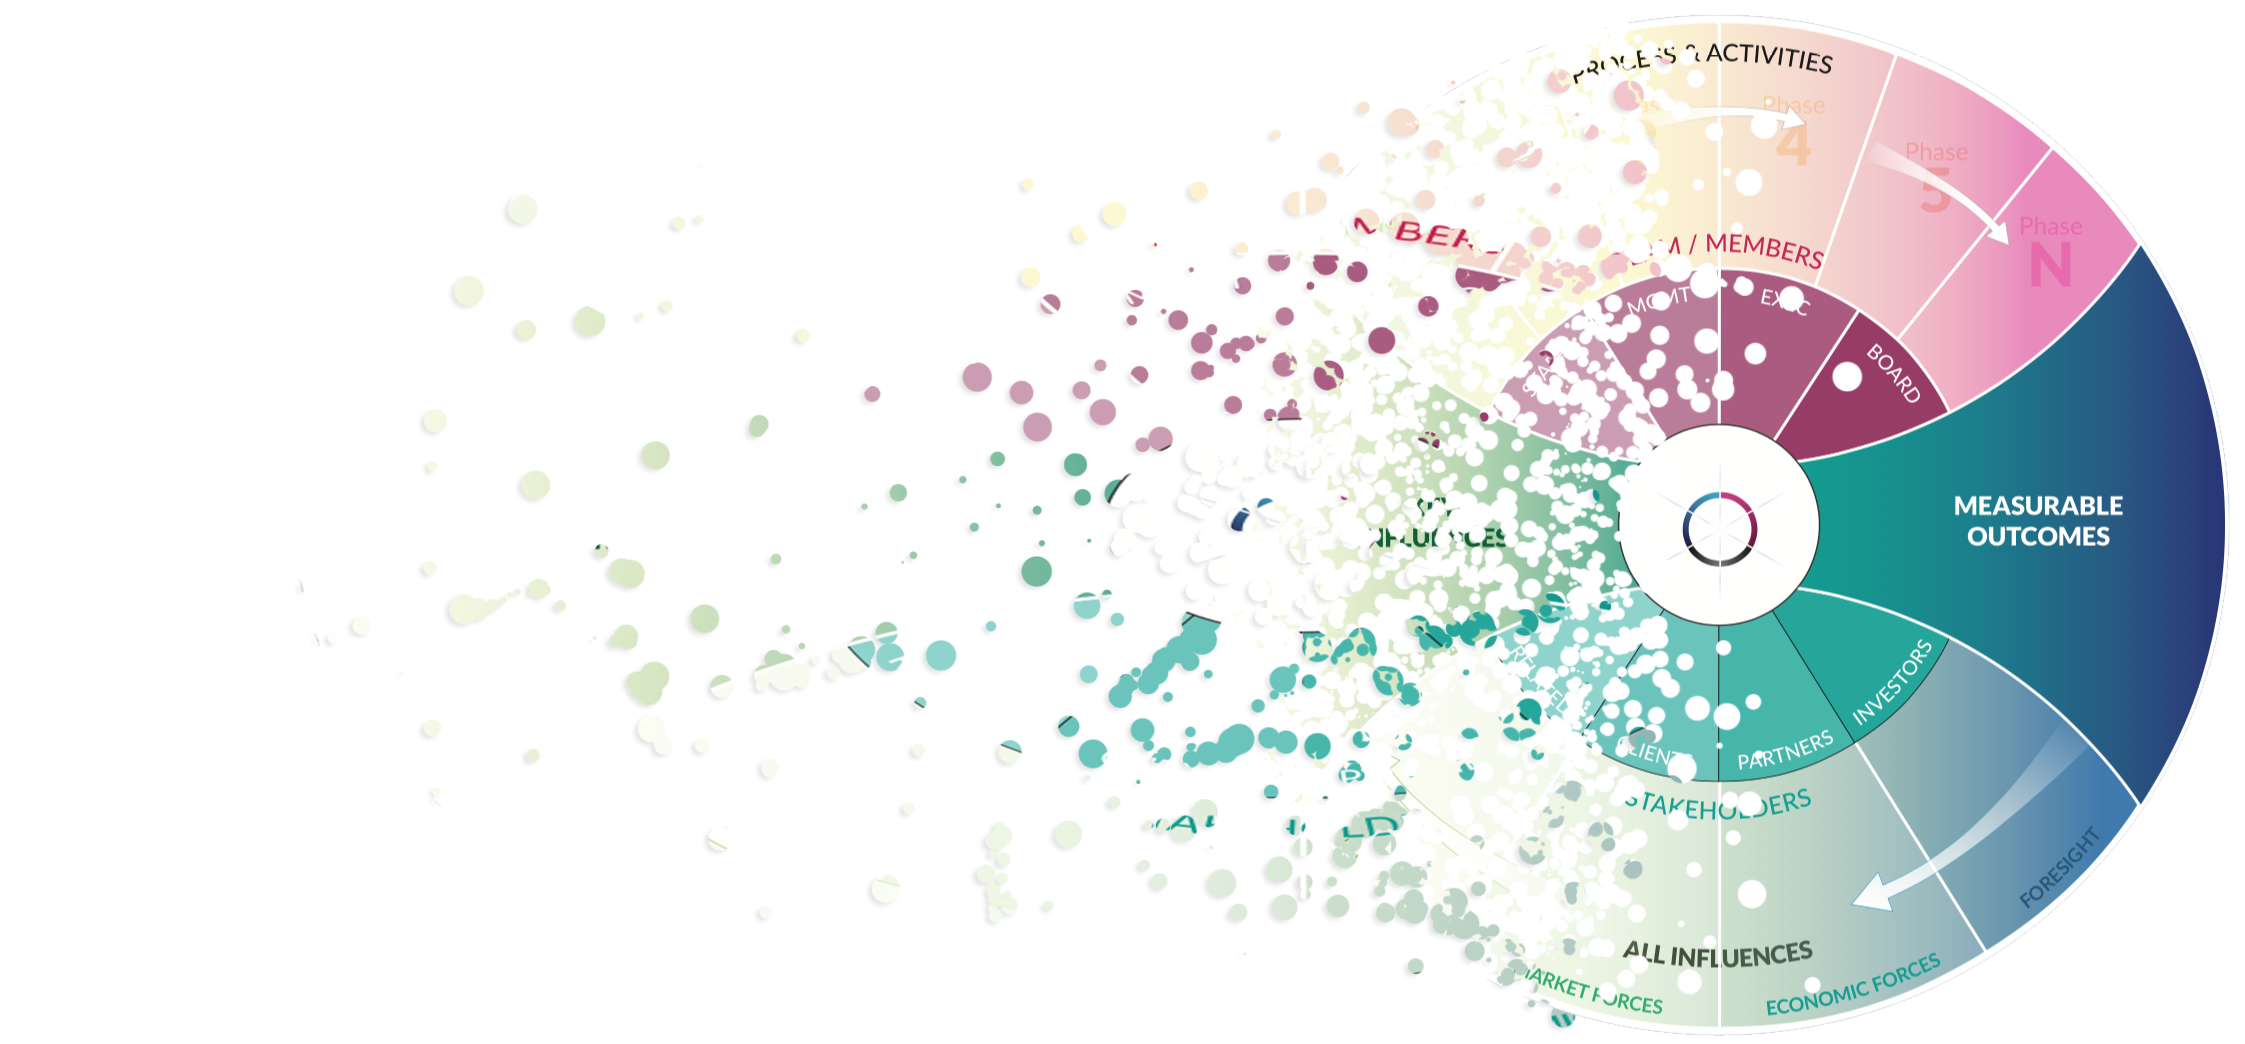
QMPAS can be used to build a lot of different "products" - digital document in various formats, web-based, interactive and exportable to PDF and excel. The template, layout and process builders make QMPAS a blank canvas ready to create anything.
You can create any kind of canvas, document, systems or logic models as "data-driven documents" that help generate, analyze, synthesize and communicate complex ideas.
Ideaboards are tools that help you collect, sort, aggregate and communicate ideas from engagements or surveys. It is the "default" canvas before any layout has been applied.
Canvases like the business model canvas are ideaboards with a layout applied. We have templates and layours for commonly used canvases like the business model canvas, alternatives like the lean model canvas, interesting one like the negotiators canvas, but you can always create your own unique layouts.
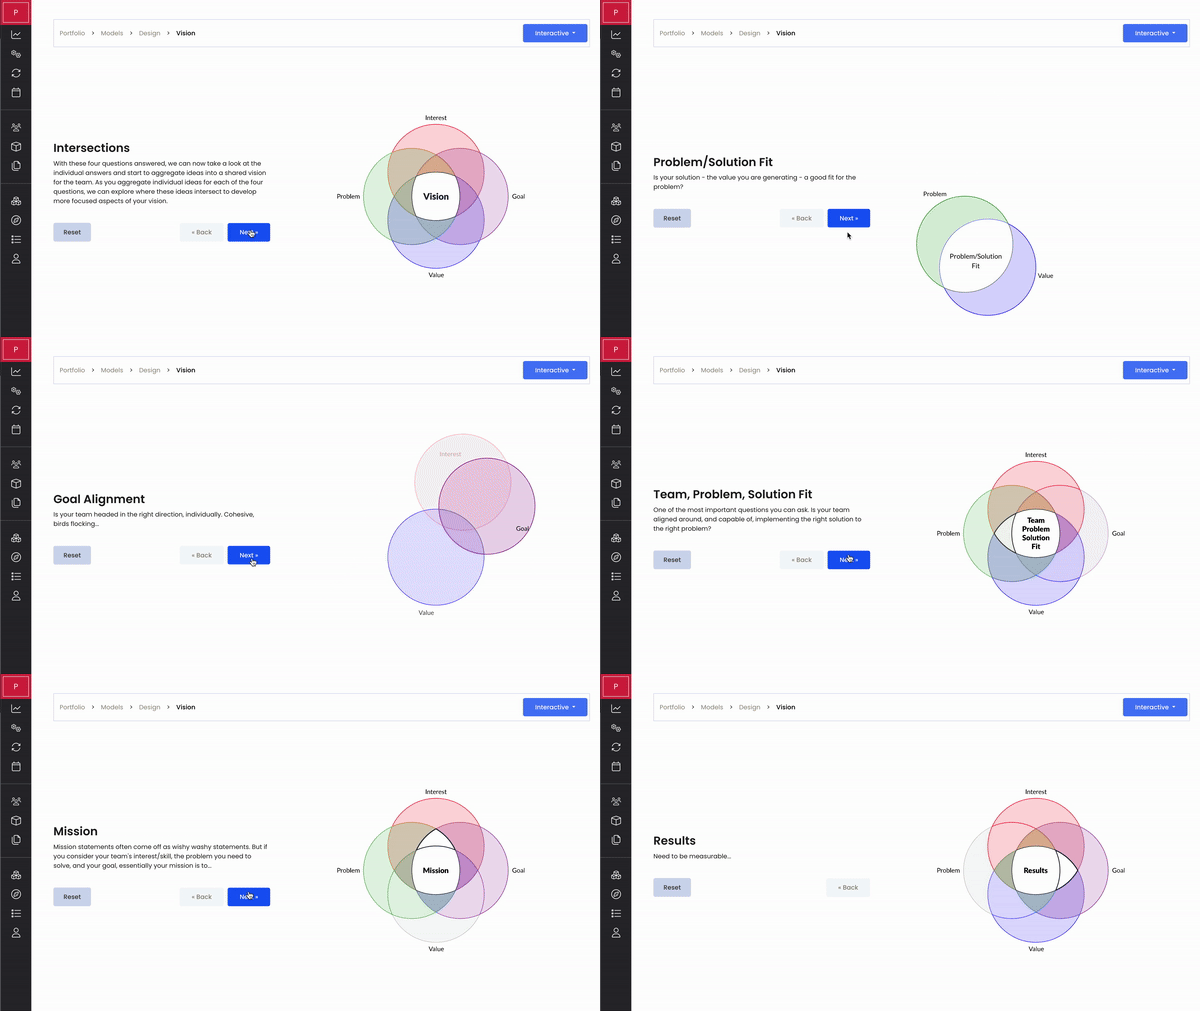
We've built some of our own, unique canvases, like the Collective Vision one shown here. These are components in themselves that guide you through creating, aggregating, prioritizing and communicating ideas for very specific purposes or outputs.
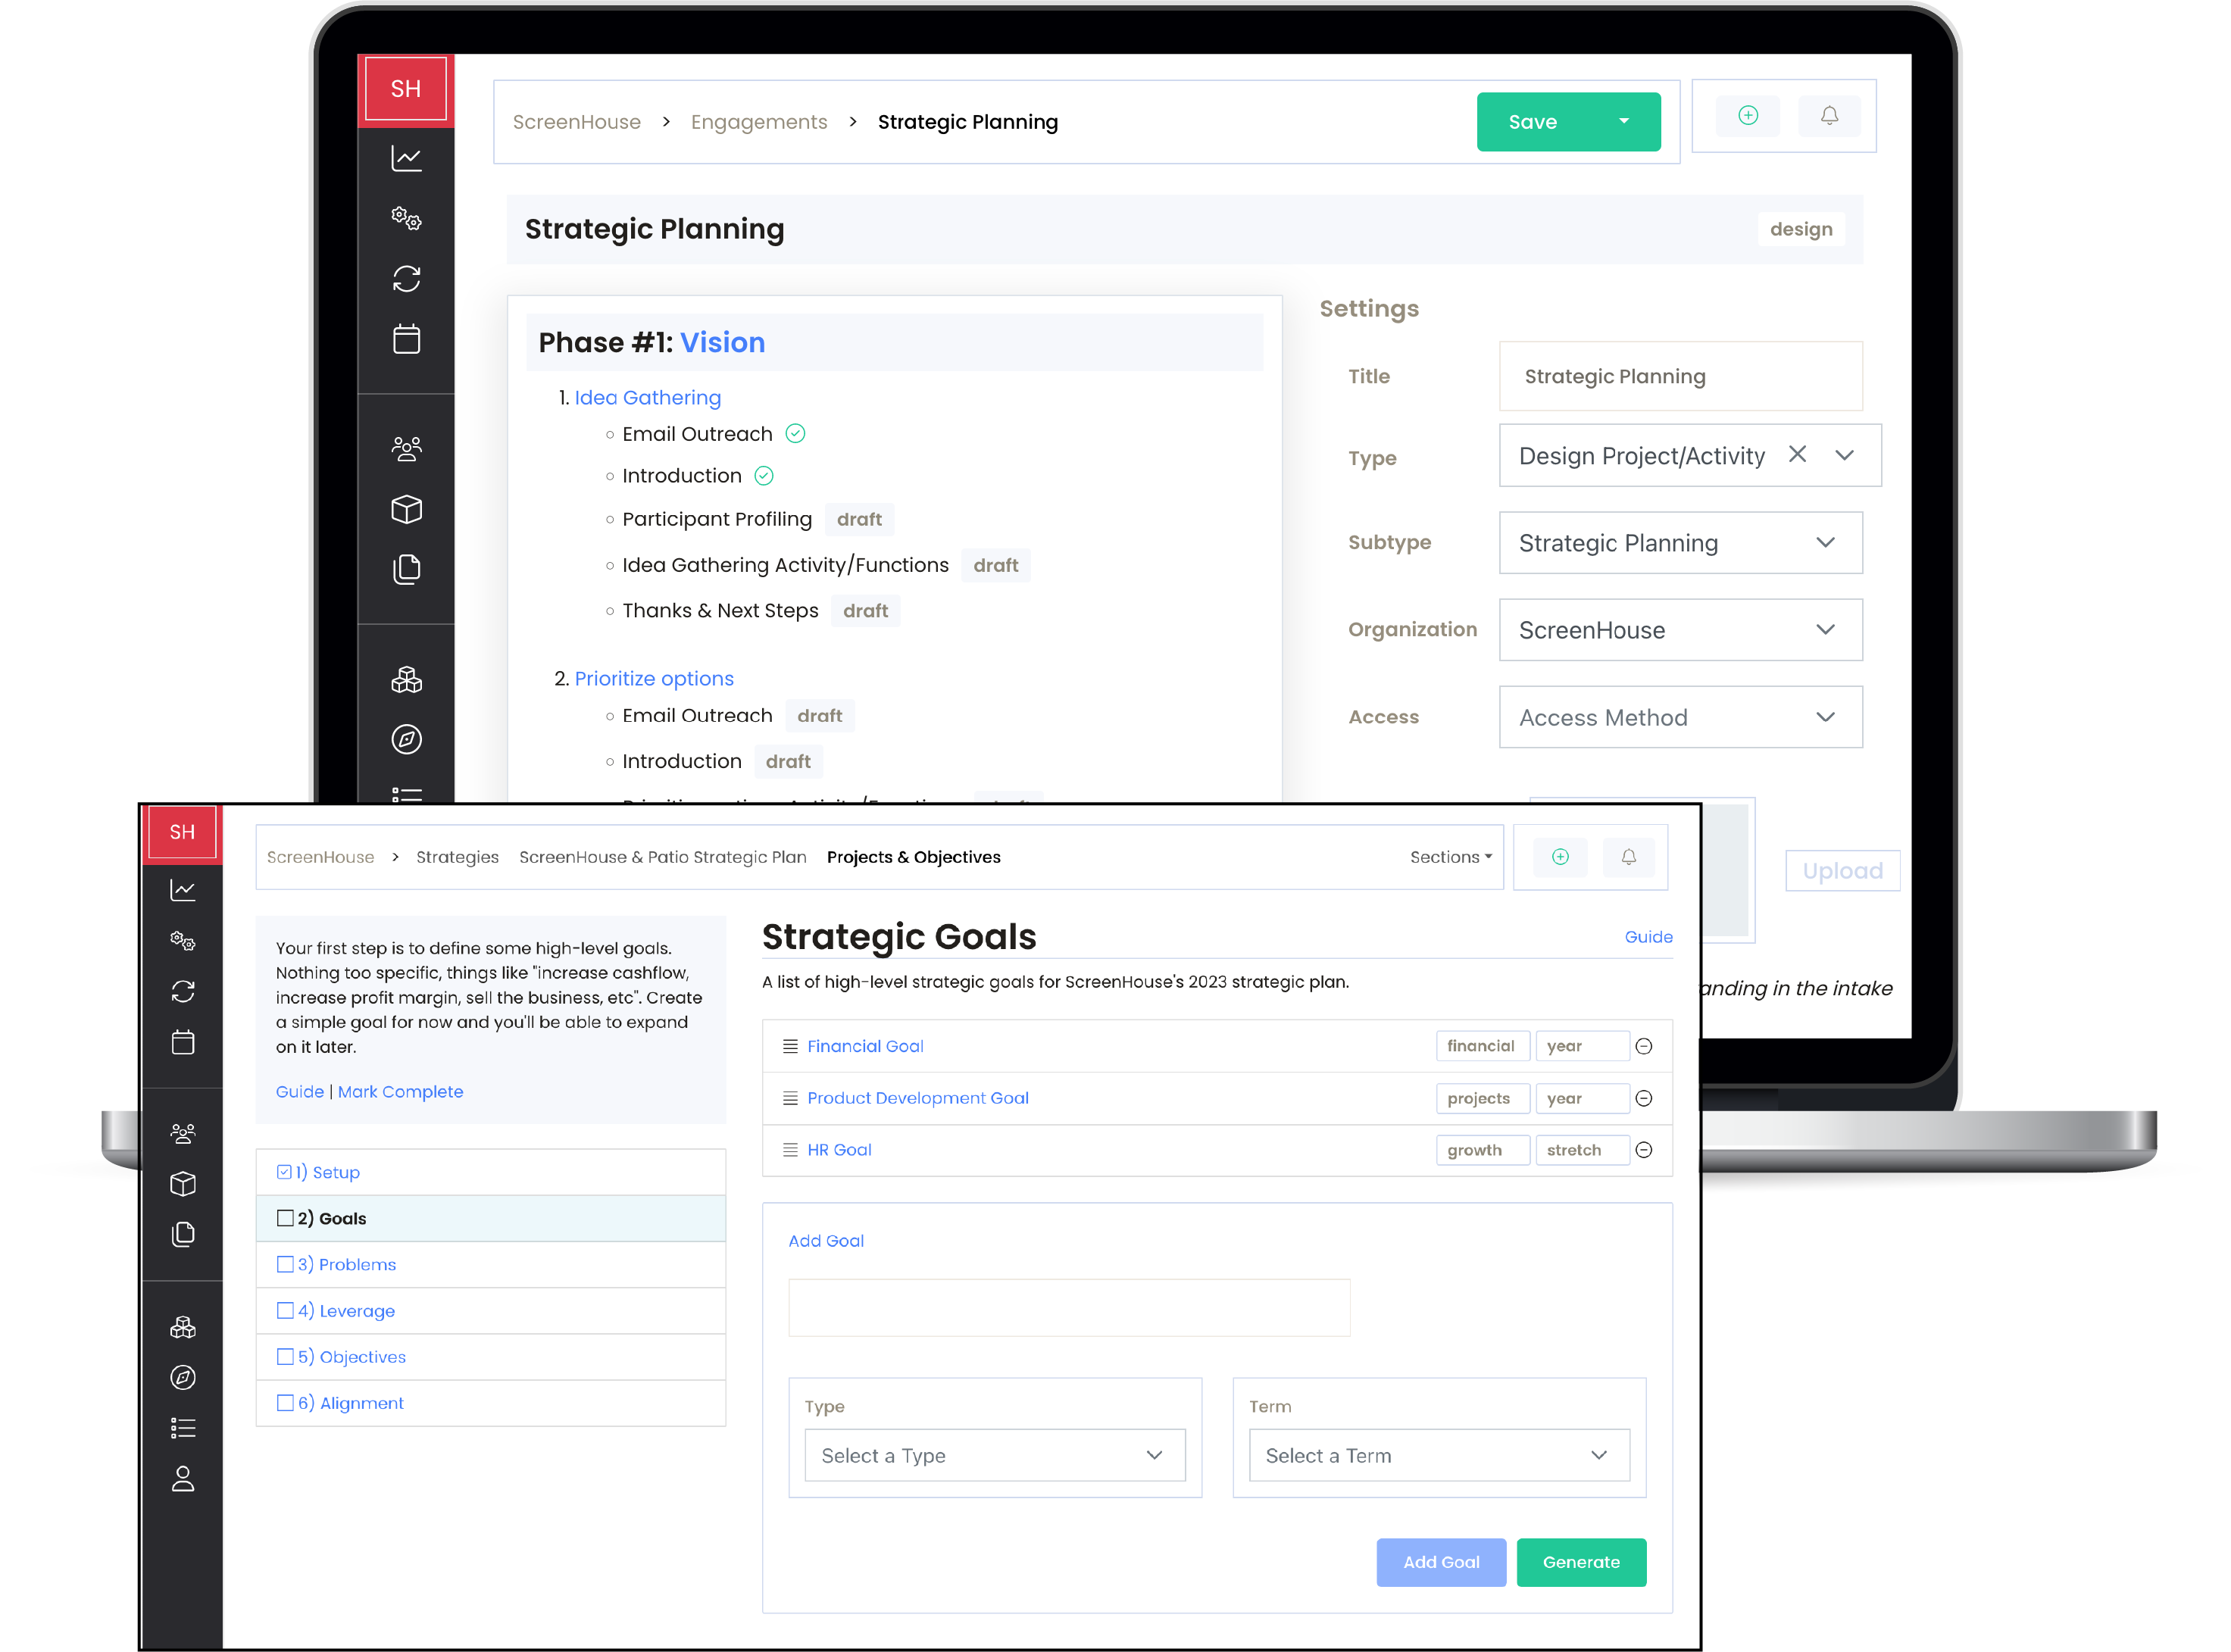
Strategic planning is a large, multi-process component in QMPAS. As a product, you can produce a unique set of webpages or PDFs that articulate the strategy itself but also the story of how your team got there. The process you used, and the results of each step along the way.
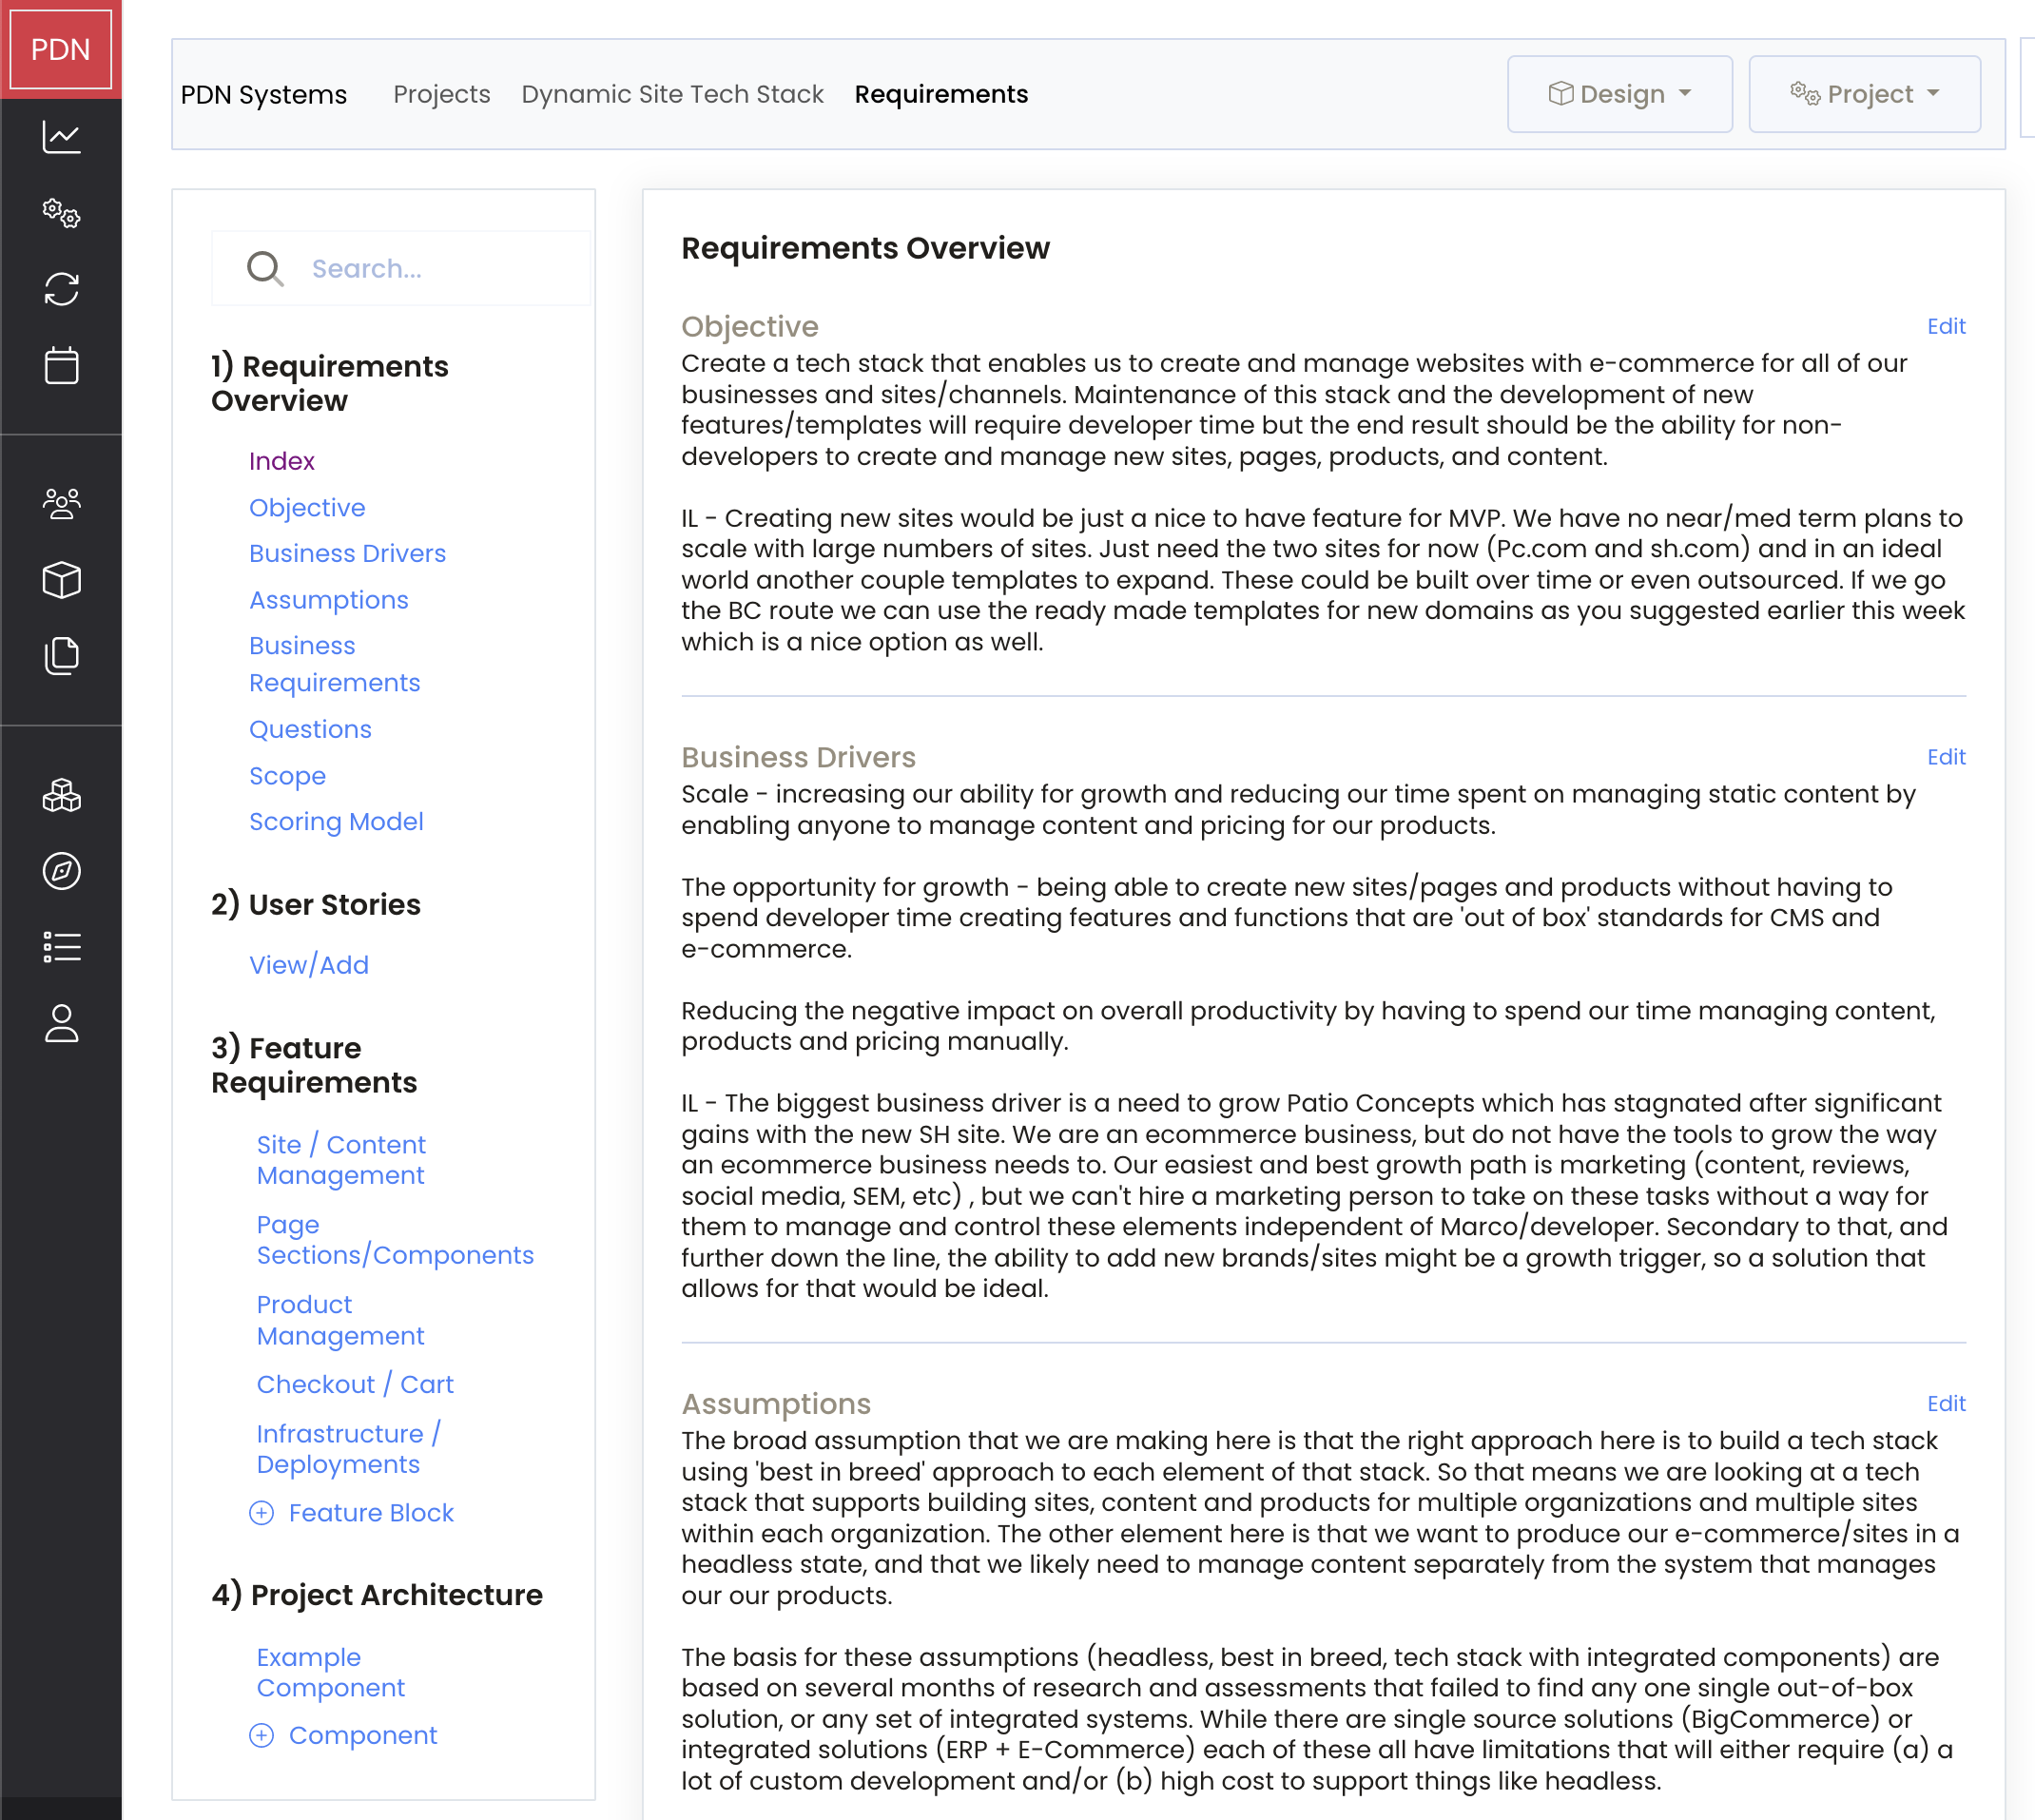
Requirements documents - and the process for creating them - are very helpful when designing a more complex product or project. The output is a navicable web-based document where you can drill down into details. The benefits of the process are tremendous.
System dynamics is a methodology and mathematical modeling technique to frame, understand, and discuss complex issues and problems. A system dynamics model is like a tool for understanding how different parts of a system interact with each other over time. Imagine you have a complex situation, like a city's traffic system, a company's growth, or even the environment. This model helps you create a model to illustrate how one thing affects another.
SD models let you play around with different scenarios without risking real-world consequences. For example, you could test what happens if you add more buses to a city's transport system, or change your business strategy. It's a way of experimenting and learning about complex systems in a safe and controlled way. They are critical to building good strategies, finding where your real leverage is, helping you make better decisions by understanding potential outcomes of different actions.
A logic model is like a map that shows you how different parts of a project or process are supposed to work together. Think of it as a blueprint or a flowchart. It outlines what you put into a project (like resources or activities), what you do (like steps in a process), and what you expect to get out of it (like outcomes or results).
These models help you plan and understand complex projects or processes. They give you a clear picture of what needs to happen, when, and how everything is connected. This can be really helpful for explaining a project to others, making sure everyone's on the same page, or figuring out where there might be problems or opportunities for improvement. Whether you're designing a new software system, planning a community program, or mapping out a business process, a logic model helps you see the big picture and the details, all in one place.
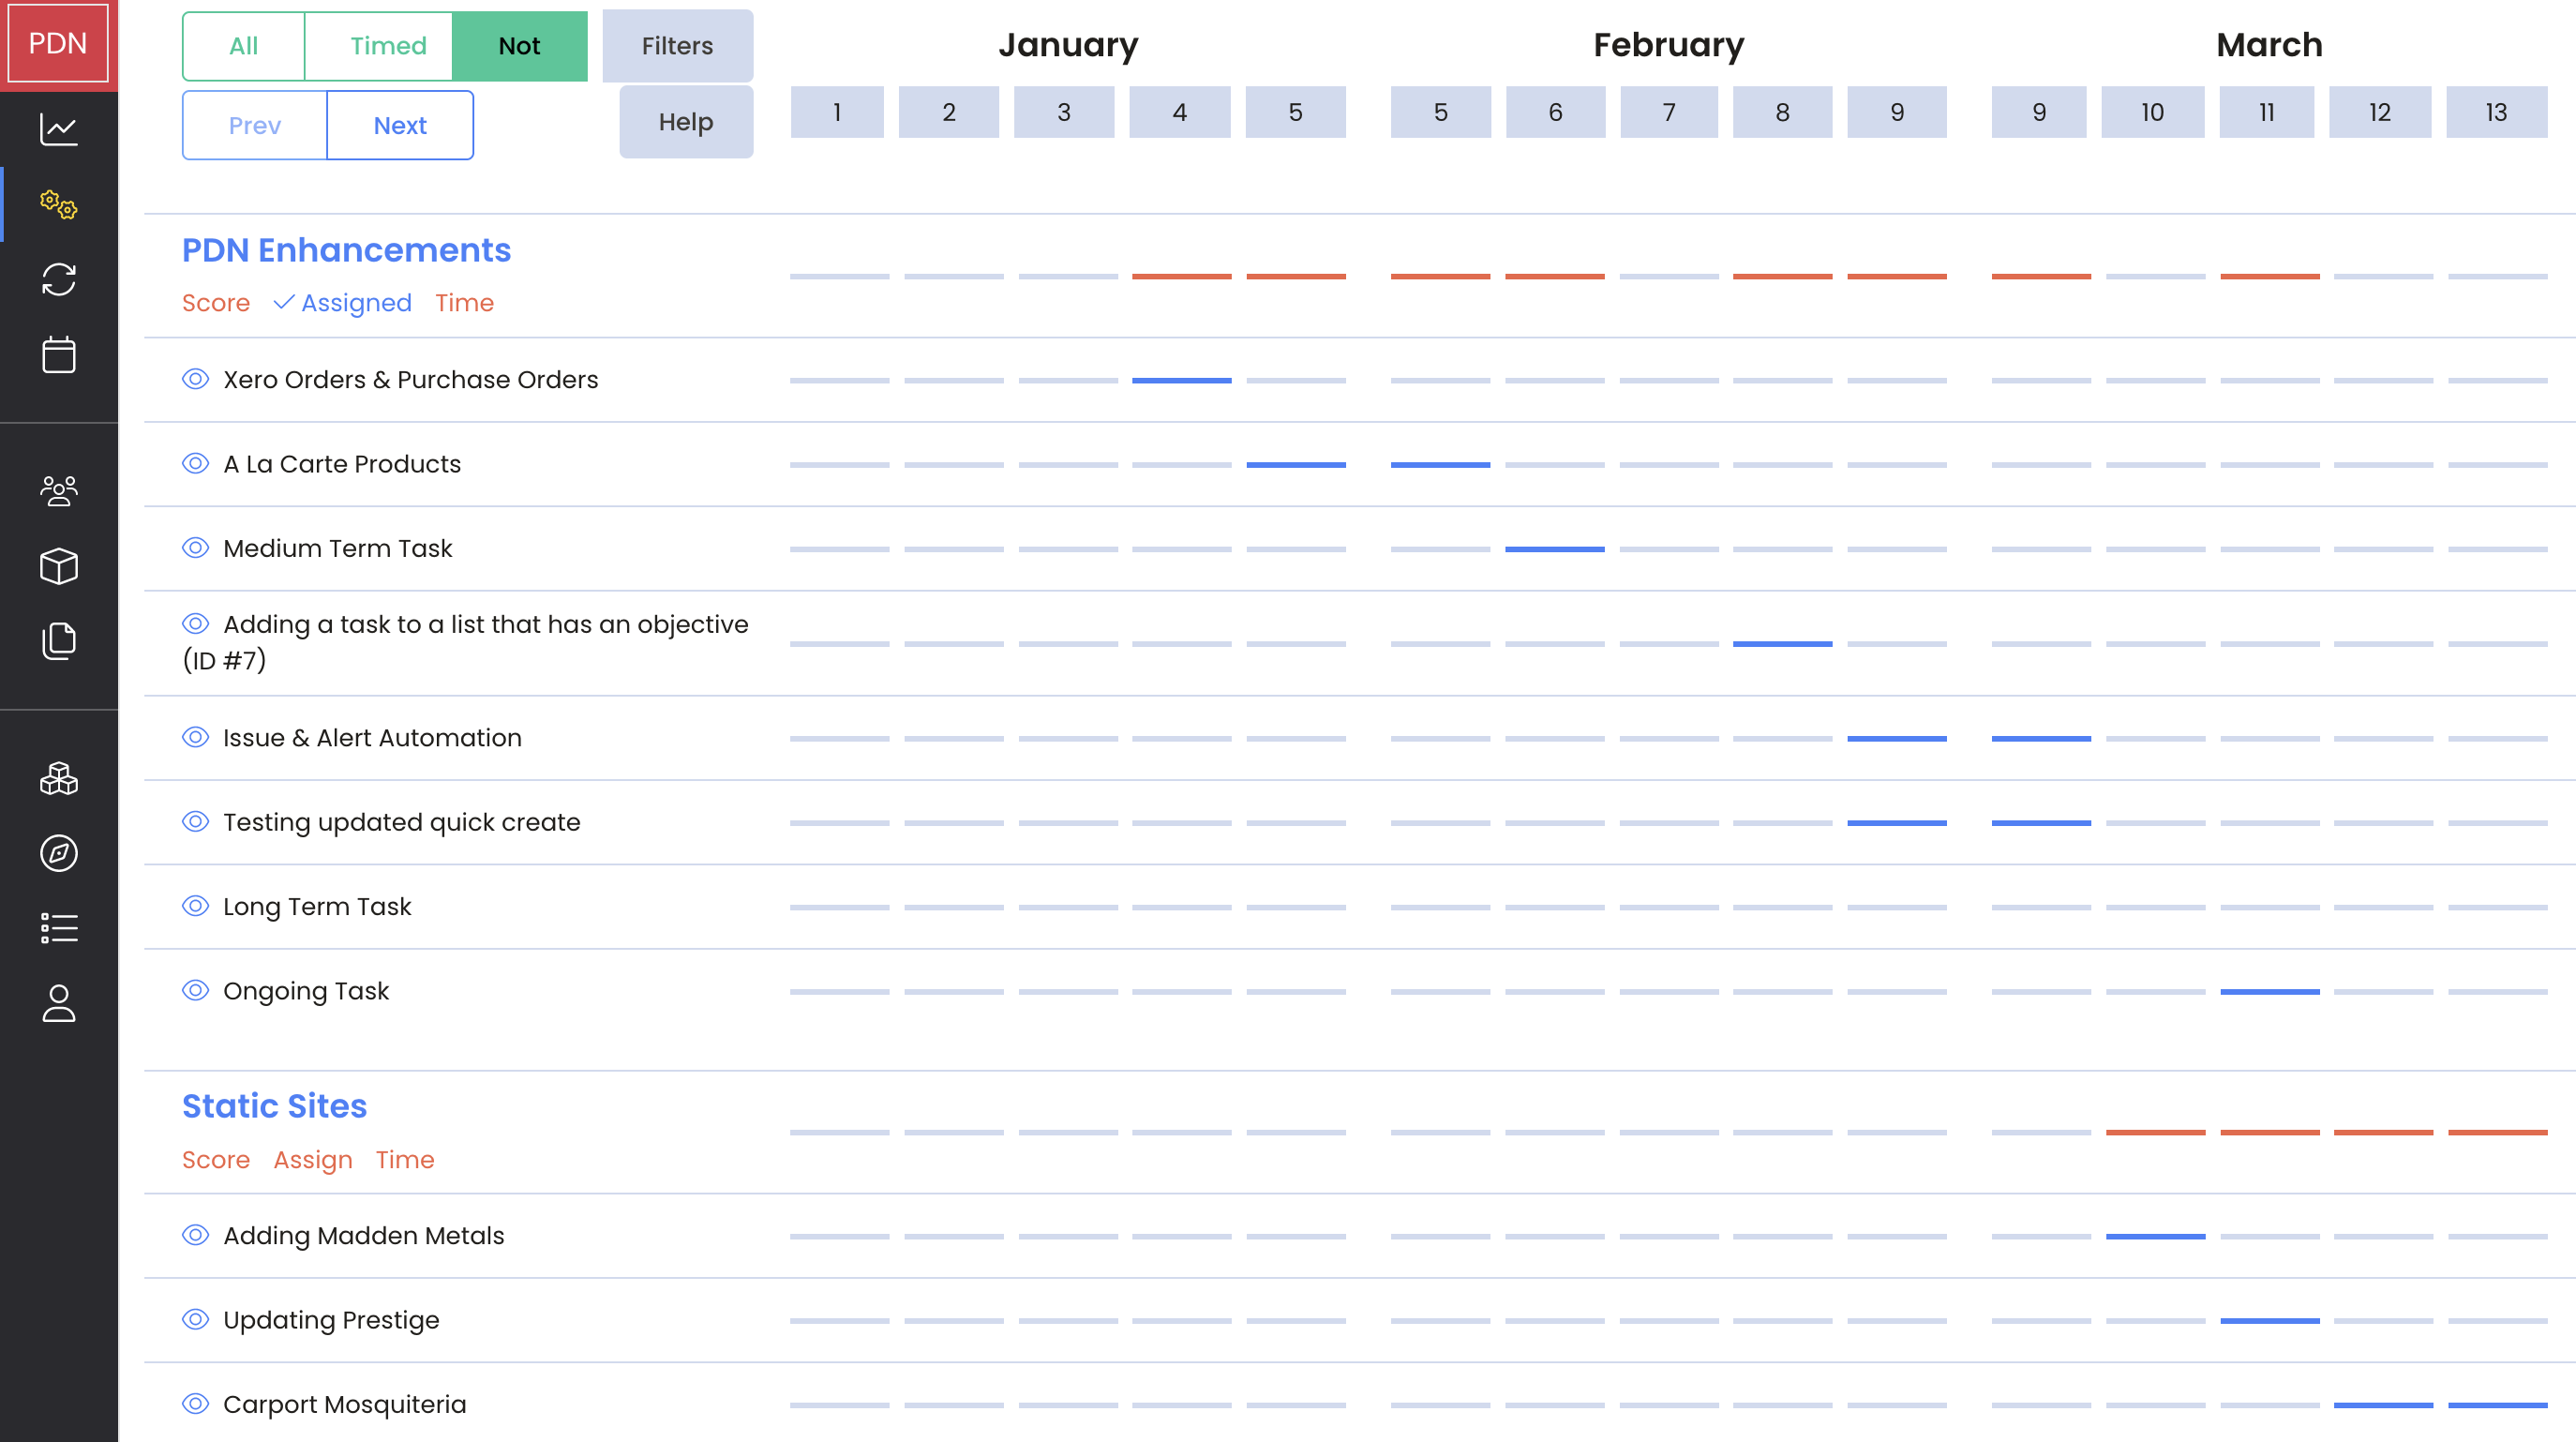
A project roadmap is like a visual timeline that lays out the key stages and tasks of a project in a simple, easy-to-understand way. Imagine it as a streamlined, user-friendly version of traditional charts like PERT or Gantt charts. Instead of getting bogged down in complex details, a project roadmap provides a high-level, month-by-month view of what needs to be done.
This type of roadmap is great because it makes it easy for everyone involved to see where the project is headed and what the major milestones are. It strips away the clutter, leaving a clear, concise picture of the project's progress and future steps. This clarity helps keep teams aligned, track progress, and ensure that everyone understands the timeline and key objectives at a glance.
Understanding how the pieces affect each other is the key to successful growth and change.